CASE / 01BRAND + EVA LABSPUBLIC SAMPLE / NO REAL PERFORMANCE DATA
KISSA COFFEE HOUSE / 喫茶こもれび
KISSA COFFEE HOUSE.
A hospitality case study that connects brand identity, menu context and a synthetic operating dataset to the EVA workflow — clean the mess, ask the business question, build the decision view.
EVA DATAEVA AIEVA LABSHospitality BIBrand-aware analysis
A quiet cup, a gentle moment.
WHAT IS SOURCE-BASED?
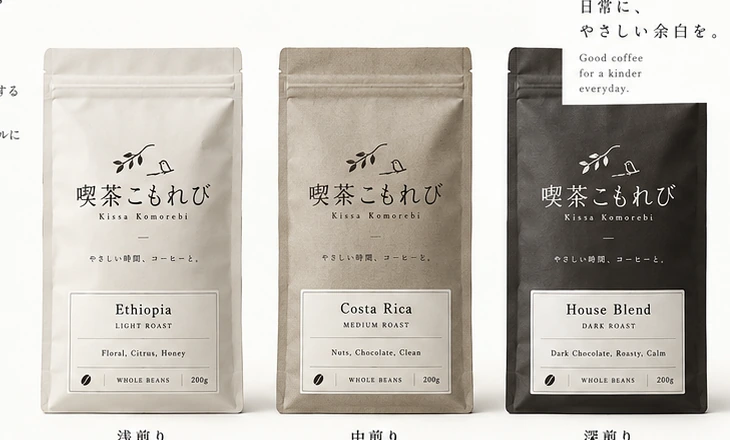
The brand story, identity, menu, coffee beans, merchandise and visual materials below come from the supplied Kissa website and brand guideline assets.
WHAT IS DEMO-BASED?
Every sales figure, customer pattern, stock warning, forecast and recommendation is generated as a synthetic EVA sample. It does not claim to describe the real business.
01 / Brand context
BEFORE WE TOUCH THE DATA
A QUIET CUP. A GENTLE MOMENT.
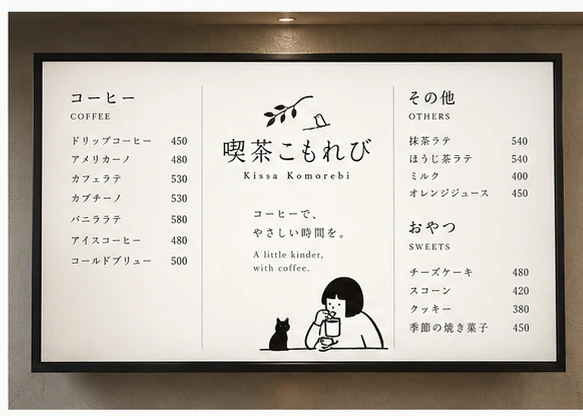
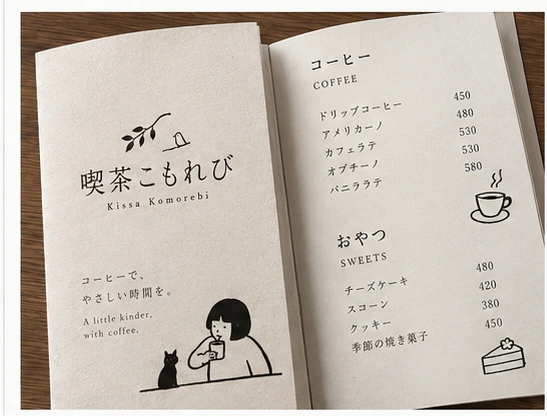
The supplied Kissa Komorebi brand is built around gentle pauses in everyday life: warm light, simple objects, good coffee and enough space to slow down.
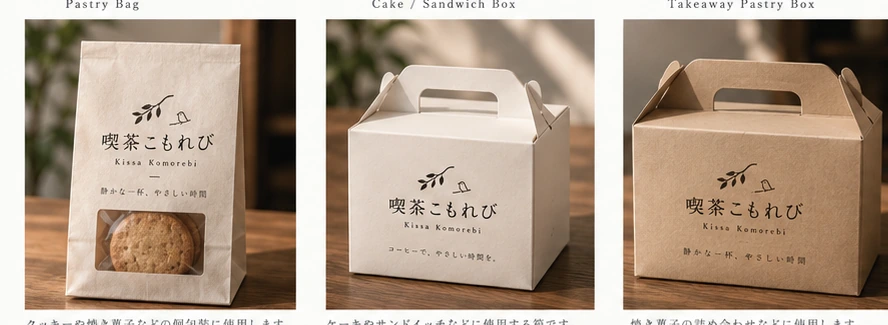
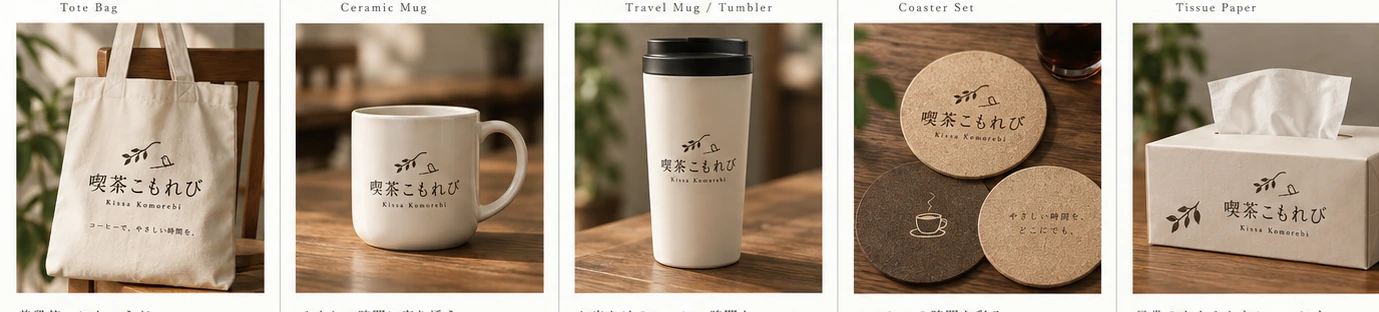
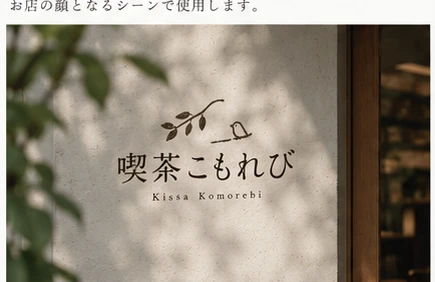
“Komorebi” describes sunlight filtering gently through leaves. The identity translates that feeling into a hand-drawn branch and bird, a restrained palette and soft, tactile applications across cups, packaging, menus, coffee bags and merchandise.
BRAND LINEGood coffee for a kinder everyday.JAPANESE LINEコーヒーで、やさしい時間を。BRAND IDEAQuiet warmth, everyday kindness, gentle repetition.DESIGN SYSTEMSnow white · warm linen · sumi black · coffee brown · soft vermilion.
Warm service, approachable flavours and a space that asks nothing from you.
02CAREFUL / ていねいに
Beans, brewing, packaging and details are considered slowly and intentionally.
03EVERYDAY / 日常に
Not a special occasion — a better little moment inside an ordinary day.
THE BUSINESS UNIVERSE.
The data model should understand the business it represents. For Kissa, that means the menu, beans, merchandise and the experience around them — not only a generic “sales” column.
POS exports, mobile orders, stock counts, loyalty fields and manual sheets arrive with different labels, formats and assumptions.
02Brand-blind optimisation
A generic dashboard can push volume without asking whether the service experience still feels calm, simple and on-brand.
03Product complexity
Coffee, food, beans and goods behave differently. One total-sales number hides the margin, frequency and operational role of each category.
04Owner attention
The goal is not more charts. It is a short list of what changed, why it matters and what to do next.
RAW → READY → RECOMMEND.
The public Kissa sample deliberately begins messy. EVA DATA repairs the reporting layer, EVA AI lets the user choose the question, and EVA LABS turns the result into a structured management view.
RAW570 synthetic rows · 32 fields
Mixed dates, JPY strings, aliases, missing cells and duplicate IDs.
→EVA DATAProfile · standardise · validate
Products, channels, dates, numeric types and source metadata become consistent.
The homepage, client case and EVA Workspace now use the same Kissa sample logic. This keeps the sales story consistent: see the raw data, see the cleanup, then see the business answer.
EVA LABS / KISSA KOMOREBICASE DASHBOARD
SYNTHETIC DATA
NET REVENUE¥1.84MModeled periodORDERS1,28443 / day avg.AVG. TICKET¥1,433Modeled KPIREPEAT GUESTS42%Sample loyalty signalPRODUCT / REVENUE SIGNAL
CAFÉ LATTE¥425K
DRIP COFFEE¥361K
VANILLA LATTE¥296K
BEANS + GOODS¥240K
EVA AI / FIX FIRST
Protect calm service during the peak window.
The modeled signal says capacity and ingredient coverage should be fixed before traffic is increased.
BRAND PROMISE
Good coffee for a kinder everyday.
Business recommendations are interpreted against the customer experience the brand is trying to create.
DATA → DECISION
01
Peak service.
Protect throughput without making the experience feel rushed.
02
Seasonal pairing.
Test a simple coffee + bake bundle.
03
Take-home growth.
Use beans and goods after-purchase, not as counter clutter.
DECISION BRIEF
01
Protect peak capacity before demand generation.
The synthetic sample suggests the immediate constraint is service/stock reliability rather than awareness.
02
Keep promotions simple.
A single coffee + seasonal bake test fits the brand better than a complex discount matrix.
03
Grow basket outside the rush.
Beans and goods can lift value without adding operational complexity at peak.
DATA HEALTH570 → CLEANSample records profiled, standardised and validated before the brief.
90-DAY SAMPLE SCENARIO¥5.55MProjected revenue under current assumptionsMODEL CAVEAT
A forecast is an assumption surface, not a promise.
Change average ticket, orders/day and COGS inside EVA Workspace to see how the curve moves.
PUBLIC DEMONSTRATIONKissa Coffee House / Kissa Komorebi
The visual identity gives EVA more context than a spreadsheet alone. The case study therefore treats branding, product structure and operational data as parts of one business system.
MENU / IN-STOREMENU / TABLESTORE / SIGNAGETAKEAWAY / PACKAGING
Have raw data. Need the decision layer?
Start with EVA DataLab for a small CSV, explore the Kissa sample in EVA Workspace, or ask EVALUATION to build a production data and decision system around your business.
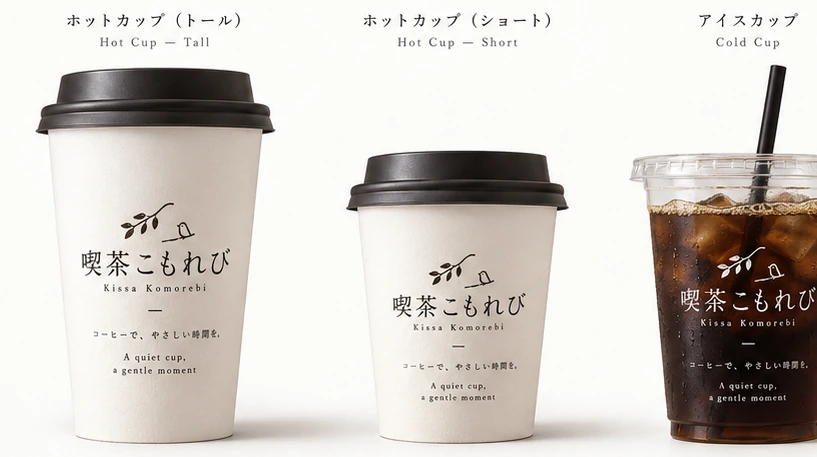
 A quiet cup, a gentle moment.
.png)
.png)
.png)